
Insights
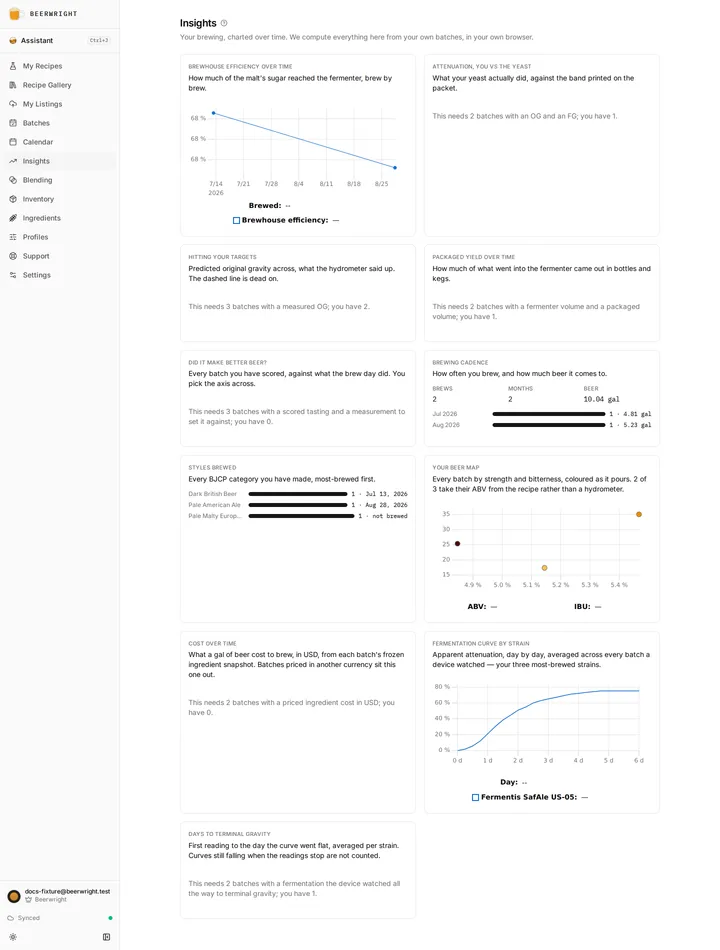
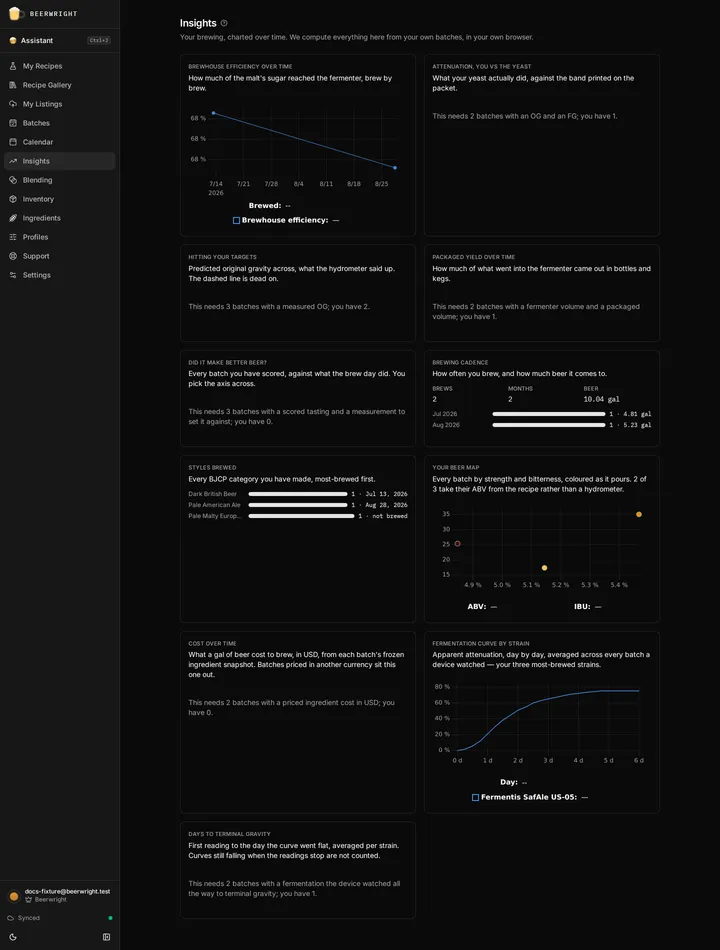
Insights is a dashboard over your own brewing, at /insights. It is eleven panels, each answering a question brewers actually ask about themselves.
Nine of them are worked out on your own device, from your own batches: nothing is uploaded, nothing is fetched, so they work offline and they work signed out. The two fermentation-device panels are the exception. Those readings were posted to your account by a device rather than typed into this browser, so we fetch them, which means they need a connection and the Beerwright plan. If we cannot reach them, those two panels are simply not there and the other nine carry on.
The brewhouse-efficiency trend is live on every plan, because it is the panel that tells you which measurement to take next. The other ten are a Beerwright feature: below that plan they are drawn from sample data with a lock on them, so you can see exactly what they would show before deciding. Your own batches keep being measured in the meantime — nothing has to be recomputed when you upgrade.
Where the numbers come from
Section titled “Where the numbers come from”Every batch keeps its own copy of the recipe you brewed it from, exactly as it was that day. Insights reads that copy rather than the recipe as it stands now, so editing a recipe next week cannot move a point on last week’s brew.
Where a measurement is missing, the batch is simply absent from that panel. A prediction is never substituted for a reading, because a trend line of your own estimates is not a trend. The one exception is the beer map, which is about your recipes as designed and says so.
A batch with no brew day is undated, not undatable: it counts in the styles rollup and appears on the beer map, and it is left out of every chart with a time axis.
The panels
Section titled “The panels”Below its threshold, a panel does not go blank — it tells you, in one sentence, which reading would fill it in. That sentence is the useful part of this page until you have brewed enough for the charts to be.
1. Brewhouse efficiency over time
Section titled “1. Brewhouse efficiency over time”How much of the malt’s available sugar actually reached your fermenter, brew by brew. Worked out from what you measured rather than read off your equipment profile, so it is what your system actually did rather than what it is set to.
Needs 2 batches with an original gravity and a volume into the fermenter.
2. Attenuation, you vs the yeast
Section titled “2. Attenuation, you vs the yeast”Apparent attenuation per brew, with the published band for the yeast you actually used drawn behind each point. Above the band your yeast outperformed the packet; below it, something stalled.
The band is drawn per batch, not per chart — two beers on different strains have different bands.
Needs 2 batches with an original gravity and a final gravity.
3. Hitting your targets
Section titled “3. Hitting your targets”Predicted original gravity across, measured original gravity up, and a dashed diagonal for “dead on”. Points above the line are brews that came in stronger than the recipe said; points below came in weaker. A cloud sitting consistently to one side is your equipment profile asking to be recalibrated: its mash efficiency and its losses are what we build the predictions on. The brewhouse efficiency beside them is your record of how the days ran, not an input.
Both axes read in your gravity units, so a Plato brewer gets a Plato chart.
Needs 3 batches with a measured original gravity.
4. Packaged yield over time
Section titled “4. Packaged yield over time”What fraction of the wort that went into the fermenter came back out as packaged beer. This is where trub, dry-hop absorption and transfer losses show up as a number instead of a shrug.
Needs 2 batches with a fermenter volume and a packaged volume.
5. Did it make better beer?
Section titled “5. Did it make better beer?”Every batch you have scored on a tasting sheet, plotted against what the brew day did. You pick what runs across the bottom — brewhouse efficiency, attenuation, yield or original gravity — and the score stays up the side, so you can ask whether the brews you rated highest have anything in common.
Above the chart: how many of your tasted batches carry a score, your average out of 50, and your best beer by name.
Needs 3 scored batches.
6. Brewing cadence
Section titled “6. Brewing cadence”Brews per month, with the liters beside them. The bar is the count — cadence is a question about rhythm, and a 40 L brew day is still one brew day. Empty months are kept rather than skipped, so a quiet winter looks quiet.
The volume of each batch is its packaged volume if it was packaged, otherwise
what went into the fermenter, otherwise what the recipe planned. Months relying
on the last of those are marked ≈.
Needs 1 batch with a brew day.
7. Styles brewed
Section titled “7. Styles brewed”Every BJCP category you have made, most-brewed first, with the date you last brewed one. Categories, not sub-styles: an American IPA, a hazy and a double are three IPAs. Recipes with no declared style get their own bar rather than disappearing.
Needs 1 batch.
8. Your beer map
Section titled “8. Your beer map”Every batch as a dot — ABV across, IBU up, colored as the beer pours. The portrait of what you actually like brewing, and the quickest way to notice that everything you make lives in the same corner.
This is the one panel that falls back to the recipe’s predicted ABV when you did not measure one, because its subject is the recipes as designed. The panel says how many of its points are predictions.
Needs 3 batches.
9. Cost over time
Section titled “9. Cost over time”What a liter of beer cost you to brew, brew by brew, from the ingredient prices each batch froze on its own brew day. Later price changes do not move an old point. Batches you priced in another currency sit this one out rather than being converted at a rate nobody agreed to.
Needs 2 batches with priced ingredients.
10. Fermentation curve by strain
Section titled “10. Fermentation curve by strain”Apparent attenuation day by day, averaged across every batch a device watched, for your three most-brewed strains. It is how you find out that the strain you think of as slow is slow every time, or was slow once.
Needs 1 watched fermentation, and a connection.
11. Days to terminal gravity
Section titled “11. Days to terminal gravity”How long each strain takes to get there: first reading to the day the curve went flat, averaged per strain, with the number of batches behind each figure. A fermentation still falling when the readings stopped is not counted, because we cannot say when it finished.
Needs 2 watched fermentations, and a connection.
Getting more out of it
Section titled “Getting more out of it”Four readings unlock most of what is above — the rest comes from a tasting sheet, from the prices on your ingredients, or from a device in the fermenter:
| Reading | Unlocks |
|---|---|
| Original gravity | Efficiency, attenuation, targets, a measured ABV on the map |
| Final gravity | Attenuation, and a measured ABV on the map |
| Volume into the fermenter | Efficiency, yield |
| Packaged volume | Yield, and honest cadence liters |
All four live on the batch page, under Measurements. None of them takes longer than the sample you were already pulling.
Calibrating from your batches
Section titled “Calibrating from your batches”Insights shows you what your system did. The Equipment page lets you act on it. Each profile there carries a Measured on this rig block: for mash efficiency, brewhouse efficiency and boil-off rate, it shows the value the profile is configured with, the value your batches actually measured, and the gap between them — with a Use measured button beside each one that writes that single figure into the profile.
The measured column is the median of every batch brewed on that profile, not the average. One stuck mash or one boil that got away produces a reading tens of percentage points off, and an average carries that straight into the suggestion. A median ignores it: four brews near 70 % and one bad day at 20 % still suggest 70 %.
A few things worth knowing:
- Nothing is ever applied for you. Changing a profile moves the predicted gravity of every recipe on it, so each button is one explicit change, undoable with ⌘Z.
- Each button writes one field. Take the boil-off rate and leave the efficiency alone if that is what you meant.
- Only these three figures are measurable. Deadspaces and absorption rates are not something a brew day back-computes, so they have no row.
- Built-in profiles are read-only. Their figures are shown, but you duplicate the profile first to record your own numbers.
- Archived batches are excluded, and each batch is matched to the rig you actually brewed it on, not to whatever profile its recipe points at today.
The same suggestion still appears on a batch page once two measured batches agree, which is where you are most likely to first notice the drift. The Equipment tab is where it stays.
What Insights does not do
Section titled “What Insights does not do”- No date filters. The page shows your whole history, always.
- No curve for one beer. The two device panels average across batches by strain. To watch a single fermentation as it happens, open its batch page; see Fermentation devices.
- No sharing. There is no way to export a panel as an image, and nothing on this page is published anywhere.
Related
Section titled “Related”- Brew day and batches, for the measurements every chart is built from.
- Plans, billing and trial codes, for what the full page needs.
- Fermentation devices, for the telemetry two of the charts read.
Something wrong on this page? Tell us.